Roulette simulation – results of one million times 100 games
Surely, as a passionate roulette player you have already heard the term ‘simulation’. On the computer, a large number of games are played. For example, with a roulette simulator you can practice a winning strategy to check whether it works. By the way, there is no working roulette strategy in online casinos. While one may be cheating at the casino, perhaps due to wheel errors or calculation where the ball will land, this is not possible in online casinos.
Nevertheless, we want to show you the impressive results of our roulette simulation. This is because it will increase your understanding of the variance in roulette. As we showed in probabilities in roulette , it is quite a fair game. If you bet on the simple odds (like “red” or “black”), you win at a “0” (zero) in the game of 18/37, i.e. in 48.7% of cases. So, statistically you double your bet in almost every second game. But how does it look in practice?
Starting position for the roulette simulation
A few casino visitors keep records of their winnings and losses. At most, they make notes of how much did other gamblers win or lose in the evening. But at the end of a visit in a casino no one will know in how many roulette games he has exactly participated. This distorts one’s perception. In retrospect, one remembers only the extreme events.
For our simulation, we have selected the following starting position: one million gamblers play 100 games of roulette. They place only simple chances. Here are the results:
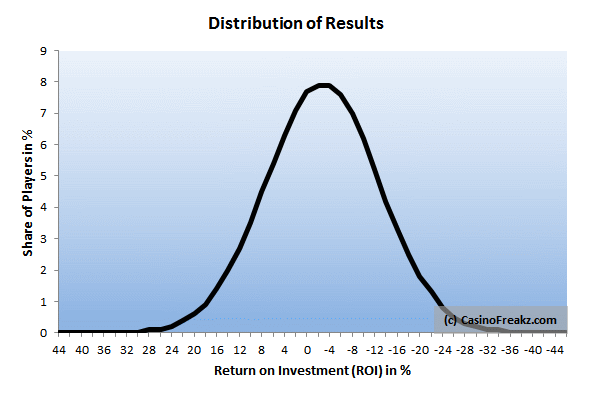
Distribution of wins / losses (returns) from the simulated games
In the graph below, you can see achieved returns from the 100 played games. The average ROI (return on investment) for roulette is a “0” and is -2.7%. In other words, the expected value of one euro is 97.3 cents. A game with one euro stake costs statistically almost three euro cents.
Nevertheless, the variance plays an important role. Hundred games is too much for one casino visit. That is why the simulation of one million players has achieved completely different results:

Legend (affinity index): 7.7% of the players have achieved a 0% return. So after this fictional casino visit, they had exactly the same amount of money after a hundred rounds, as when they entered the casino.
The graphic shows a typical Gaussian bell curve. This normal distribution is often found in the probability calculation. What one can read from it is the following:
- In our simulation, over two-thirds of all players earned a return between + 6% and -12%. This means that if you go to the casino with €100 and play hundred rounds for €1 at the roulette table, you will end up in more than 2/3 of the cases with €88 to €106.
- Approximately every eighth player will make more than €10 profit. And 98% of the players will have €78 or more left.
- If you always make the same bet on simple odds, you can gamble for a long time and have loads of fun at the casino.
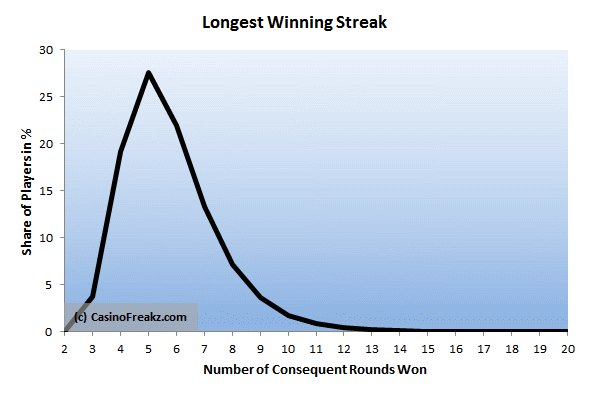
Longest winning streaks in roulette simulation
We also measured the winning streaks in the simulation with the random numbers. As a quick reminder, a million players made their bets 100 times each in roulette with an even chance like red or black.

In these hundred games have:
- 19% have won four consequent rounds
- almost 28% have won five consequent rounds
- 22% have won six consequent rounds
- 13% have won four consequent rounds
- And one out of seven players have doubled their bets eight or more times
Eine Roulette Glückssträhne von 10 oder mehr gewonnenen Spielen wiesen immerhin noch 3.4% aller Spieler auf. Aus dieser Angabe kann man eine weitere Wahrscheinlichkeitsrechnung anstellen. Wenn Du bei jedem Casino-Besuch auf einfache Chancen setzt und genau hundert Mal Roulette spielst, dann ist Deine Chance auf zehn in Serie gewonnene Einsätze:
A roulette streak of 10 or more rounds happened to 3.4% of all players. From this statement, a further probability calculation can be made. If you gamble with simple odds at every casino visit and exactly one hundred times, then your chance to get ten stakes in series is:
- 1 visit: 3.4%
- 2 visits: 6.7%
- 5 visits: 15.9%
- 10 visits: 29.2%
- 20 visits: 49.9%
- 30 visits: 64.6%
So if you go to the casino for a month and each time play 100 turns, there is almost 2/3 probability that you will experience a winning streak of 10 or more rounds.
This data can also be read differently – from the perspective of an observer. If you watch frequently enough, you will also often see series where, for example, always “red” or an even number is pulled. Six or more times “red” has appeared in our simulation every second time.
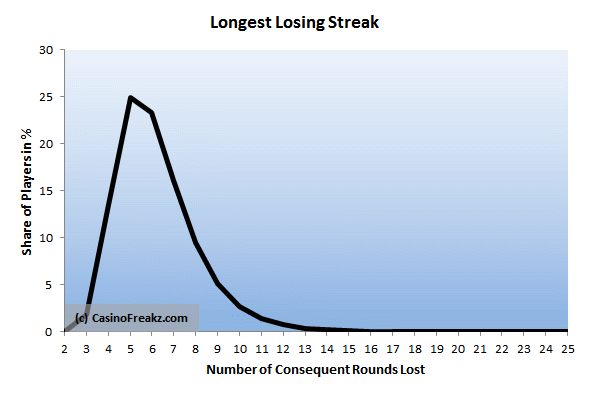
Frequency of losing streaks in the roulette simulation
As mentioned, roulette is a quite fair casino game, therefore the distribution of the losing streaks looks very similar to the winning streaks. However, it is shifted slightly further to the right in the graphic:

It should not be expected otherwise, but the losing streaks in the roulette are slightly more frequent than winning streaks:
- 14% players have lost four consequent rounds
- 25% players have lost five consequent rounds
- 23% players didn’t succeed four consequent rounds
- every sixth player had no luck seven times
- And every fifth roulette player even experienced 8 or more consecutive losses
We hope to have brought you closer to the variance – luck and bad luck in roulette with the results of our simulation.
Leave a comment if you have questions about this article or if you have an idea for another roulette simulation.
